|
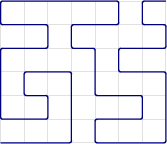
Ein selbstmeidender oder Hamiltonscher Gittergraph ist ein Gitter bestimmter Breite und Höhe, in dem ein Pfad liegt, durch den jeder Gitterpunkt genau einmal besucht wird. Frage zur Selbstbeantwortung. Weitere Antworten sind aber erlaubt und gern gesehen. |
|
Eine Möglichkeit ist, erstmal ein Gitter zu erstellen und dessen Gitterpunkte mit einfachen Koordinaten zu benennen. Von links unten nach rechts oben sieht das dann so aus: \begin{tikzpicture}[scale=0.5, font=\footnotesize] \def\Gitterweite{4} \def\Gitterbreite{\Gitterweite} \def\Gitterhoehe{\Gitterweite} % Gitterkoordinaten \foreach \x in {0,...,\Gitterbreite}{ \foreach \y in {0,...,\Gitterhoehe}{ \coordinate[label={\x-\y}] (\x-\y) at (\x,\y); }} \end{tikzpicture} Für das Bild im Startpost erhält man so z.B.: \begin{tikzpicture}[scale=0.5] \def\Gitterbreite{7} \def\Gitterhoehe{6} \def\Koordinatenliste{(0-0) (3-0) (3-3) (1-3) (1-2) (2-2) (2-1) (0-1) (0-4) (2-4) (2-5) (0-5) (0-6) (5-6) (5-5) (3-5) (3-4) (4-4) (4-2) (6-2) (6-1) (4-1) (4-0) (7-0) (7-3) (5-3) (5-4) (7-4) (7-5) (6-5) (6-6) (7-6)} % Gitterkoordinaten \foreach \x in {0,...,\Gitterbreite}{ \foreach \y in {0,...,\Gitterhoehe}{ \coordinate[] (\x-\y) at (\x,\y); %label={\x-\y} }} % Grid \draw[help lines] (0,0) grid (\Gitterbreite, \Gitterhoehe); % Pfad \draw[black!50!blue, rounded corners=0.3ex, thick] plot[] coordinates{\Koordinatenliste}; \end{tikzpicture} Listen: Um auch ganze Listen, für die verschiedenen Möglichkeiten, zu erstellen, ist es sinnvoll, daraus eine newcommand-Anweisung zu machen.
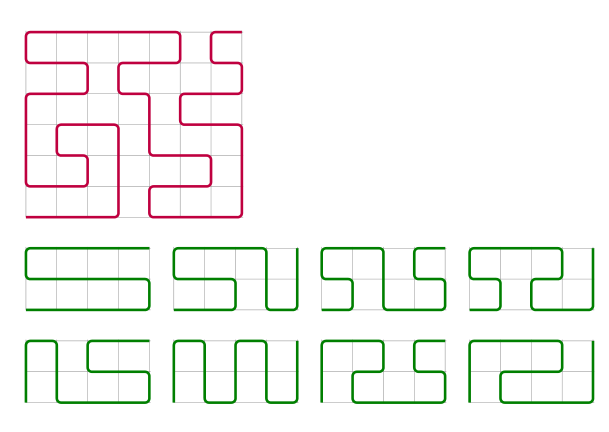
Etwa: Beispiel: % \GitterPfad{<Gitterbreite>}{<Gitterhoehe>}{<Farbe>}{<Koordinatenliste>} \newcommand{\GitterPfad}[4]{% ======================= \begin{tikzpicture}[scale=0.5] \def\Gitterbreite{#1} % 7 \def\Gitterhoehe{#2} % 6 \foreach \x in {0,...,\Gitterbreite}{ \foreach \y in {0,...,\Gitterhoehe}{ \coordinate[] (\x-\y) at (\x,\y); %label={\x-\y} }} % Grid \draw[help lines] (0,0) grid (\Gitterbreite, \Gitterhoehe); % Pfad \def\Koordinatenliste{#4} \draw[color=#3, rounded corners=0.3ex, thick] plot[] coordinates{\Koordinatenliste}; \end{tikzpicture} } %================================== \GitterPfad{4}{3}{red}{(0-0) (1-0) (2-0) (3-0) (4-0) (4-1) (3-1) (2-1) (1-1) (0-1) (0-2) (1-2) (2-2) (3-2) (4-2)} Ganzes Beispiel: \documentclass[border=5pt, varwidth]{standalone} \usepackage{tikz} \begin{document} % \GitterPfad{<Gitterbreite>}{<Gitterhoehe>}{<Farbe>}{<Koordinatenliste>} \newcommand{\GitterPfad}[4]{% ======================= \begin{tikzpicture}[scale=0.5] \def\Gitterbreite{#1} % 7 \def\Gitterhoehe{#2} % 6 \foreach \x in {0,...,\Gitterbreite}{ \foreach \y in {0,...,\Gitterhoehe}{ \coordinate[] (\x-\y) at (\x,\y); %label={\x-\y} }} % Grid \draw[help lines] (0,0) grid (\Gitterbreite, \Gitterhoehe); % Pfad \def\Koordinatenliste{#4} \draw[color=#3, rounded corners=0.3ex, thick] plot[] coordinates{\Koordinatenliste}; \end{tikzpicture} \vspace{0.5ex} } %================================== \GitterPfad{4}{3}{red}{(0-0) (1-0) (2-0) (3-0) (4-0) (4-1) (3-1) (2-1) (1-1) (0-1) (0-2) (1-2) (2-2) (3-2) (4-2)} \foreach \n in { (0-0) (1-0) (2-0) (3-0) (4-0) (4-1) (3-1) (2-1) (1-1) (0-1) (0-2) (1-2) (2-2) (3-2) (4-2), (0-0) (1-0) (2-0) (2-1) (1-1) (0-1) (0-2) (1-2) (2-2) (3-2) (3-1) (3-0) (4-0) (4-1) (4-2), (0-0) (1-0) (1-1) (0-1) (0-2) (1-2) (2-2) (2-1) (2-0) (3-0) (4-0) (4-1) (3-1) (3-2) (4-2), (0-0) (1-0) (1-1) (0-1) (0-2) (1-2) (2-2) (3-2) (3-1) (2-1) (2-0) (3-0) (4-0) (4-1) (4-2) }{% \GitterPfad{4}{3}{black!50!green}{\n} }\\ \foreach \n in { (0-0) (0-1) (0-2) (1-2) (1-1) (1-0) (2-0) (3-0) (4-0) (4-1) (3-1) (2-1) (2-2) (3-2) (4-2), (0-0) (0-1) (0-2) (1-2) (1-1) (1-0) (2-0) (2-1) (2-2) (3-2) (3-1) (3-0) (4-0) (4-1) (4-2), (0-0) (0-1) (0-2) (1-2) (2-2) (2-1) (1-1) (1-0) (2-0) (3-0) (4-0) (4-1) (3-1) (3-2) (4-2), (0-0) (0-1) (0-2) (1-2) (2-2) (3-2) (3-1) (2-1) (1-1) (1-0) (2-0) (3-0) (4-0) (4-1) (4-2) }{% \GitterPfad{4}{3}{black!50!green}{\n} }% \end{document} |
|
Man könnte auch die \documentclass{article} \usepackage{tikz} \usetikzlibrary{turtle} \usetikzlibrary{backgrounds} \newcommand*\Gitterpfad[2][]{% \begin{tikzpicture}[gitterpfad,#1] \draw[turtle={home,#2}]; \begin{scope}[on background layer] \draw[help lines](current bounding box.south west)grid(current bounding box.north east); \end{scope} \end{tikzpicture}% } \tikzset{gitterpfad/.style={scale=.5,green!50!black,rounded corners=2pt,very thick}} \begin{document} \Gitterpfad[purple]{ rt,fd=3,lt,fd=3,lt,fd=2,lt,fd,lt,fd,rt,fd,rt,fd=2,rt,fd=3, rt,fd=2,lt,fd,lt,fd=2,rt,fd,rt,fd=5,rt,fd,rt,fd=2, lt,fd,lt,fd,rt,fd=2,lt,fd=2,rt,fd,rt,fd=2,lt,fd,lt,fd=3, lt,fd=3,lt,fd=2,rt,fd,rt,fd=2,lt,fd,lt,fd,rt,fd,rt,fd } \par\bigskip \Gitterpfad{rt,fd=4,lt,fd,lt,fd=4,rt,fd,rt,fd=4}\quad \Gitterpfad{rt,fd=2,lt,fd,lt,fd=2,rt,fd,rt,fd=3,rt,fd=2,lt,fd,lt,fd=2}\quad \Gitterpfad{rt,fd,lt,fd,lt,fd,rt,fd,rt,fd=2,rt,fd=2,lt,fd=2,lt,fd,lt,fd,rt,fd,rt,fd}\quad \Gitterpfad{rt,fd,lt,fd,lt,fd,rt,fd,rt,fd=3,rt,fd,rt,fd,lt,fd,lt,fd=2,lt,fd=2} \par\bigskip \Gitterpfad{fd=2,rt,fd,rt,fd=2,lt,fd=3,lt,fd,lt,fd=2,rt,fd,rt,fd=2}\quad \Gitterpfad{fd=2,rt,fd,rt,fd=2,lt,fd,lt,fd=2,rt,fd,rt,fd=2,lt,fd,lt,fd=2}\quad \Gitterpfad{fd=2,rt,fd=2,rt,fd,rt,fd,lt,fd,lt,fd=3,lt,fd,lt,fd,rt,fd,rt,fd}\quad \Gitterpfad{fd=2,rt,fd=3,rt,fd,rt,fd=2,lt,fd,lt,fd=3,lt,fd=2} \end{document}
|


Das ist aber keine besonders gute Beispielfrage, so ganz ohne Minimalbeispiel.
Ich beantworte die Frage ja selbst:
Frage zur Selbstbeantwortung. Weitere Antworten sind aber erlaubt und gern gesehen.
Da ist es erlaubt.