|
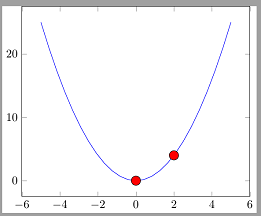
\documentclass{standalone} \usepackage{pgfplots} \begin{document} \begin{tikzpicture} \begin{axis}[] \addplot+[mark=none]{x^2)}; \addplot[only marks,mark=*,mark options={scale=2, fill=red},text mark as node=true] coordinates { (0,0) (2,4)}; \end{axis} \end{tikzpicture} \end{document} |
|
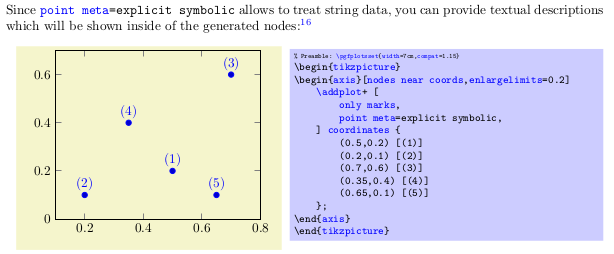
Du zitierst zwar in der Frage die Anleitung, hast aber anscheinend deine exakte Anwendung auf Seite 114 übersehen.
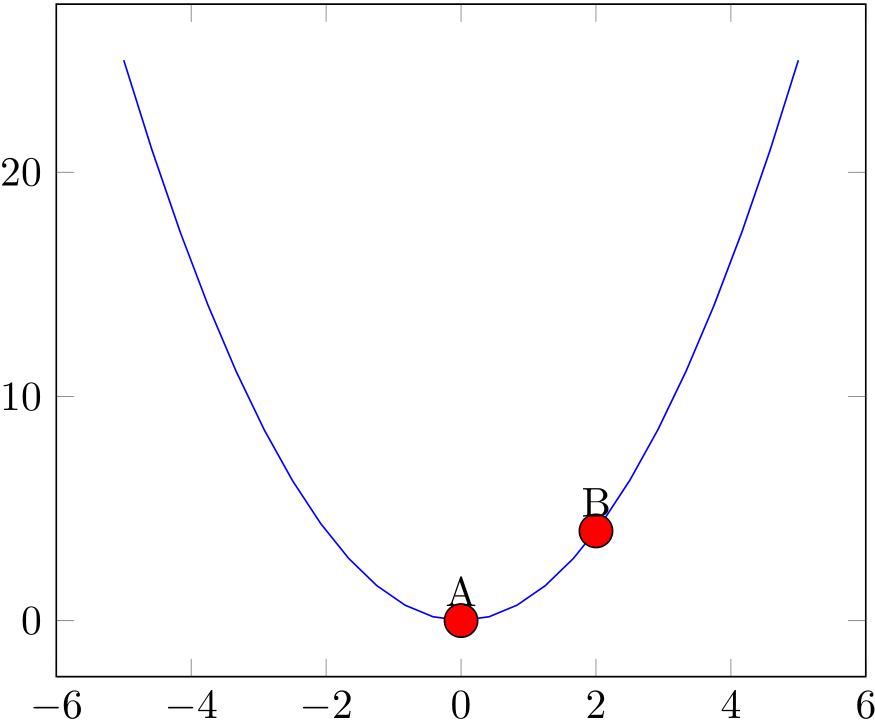
\documentclass{article}
\usepackage{pgfplots}
\pgfplotsset{compat=newest}

\begin{document}
\begin{tikzpicture}
  \begin{axis}[]
    \addplot+[mark=none]{x^2)};
    \addplot[only marks,mark=*,mark options={scale=2, fill=red},text mark as node=true,point meta=explicit symbolic,nodes near coords] coordinates { (0,0) [A]   (2,4) [B]};
  \end{axis}
\end{tikzpicture}
\end{document}
Danke Dir!
(03 Feb '18, 10:15)
cis
|