|
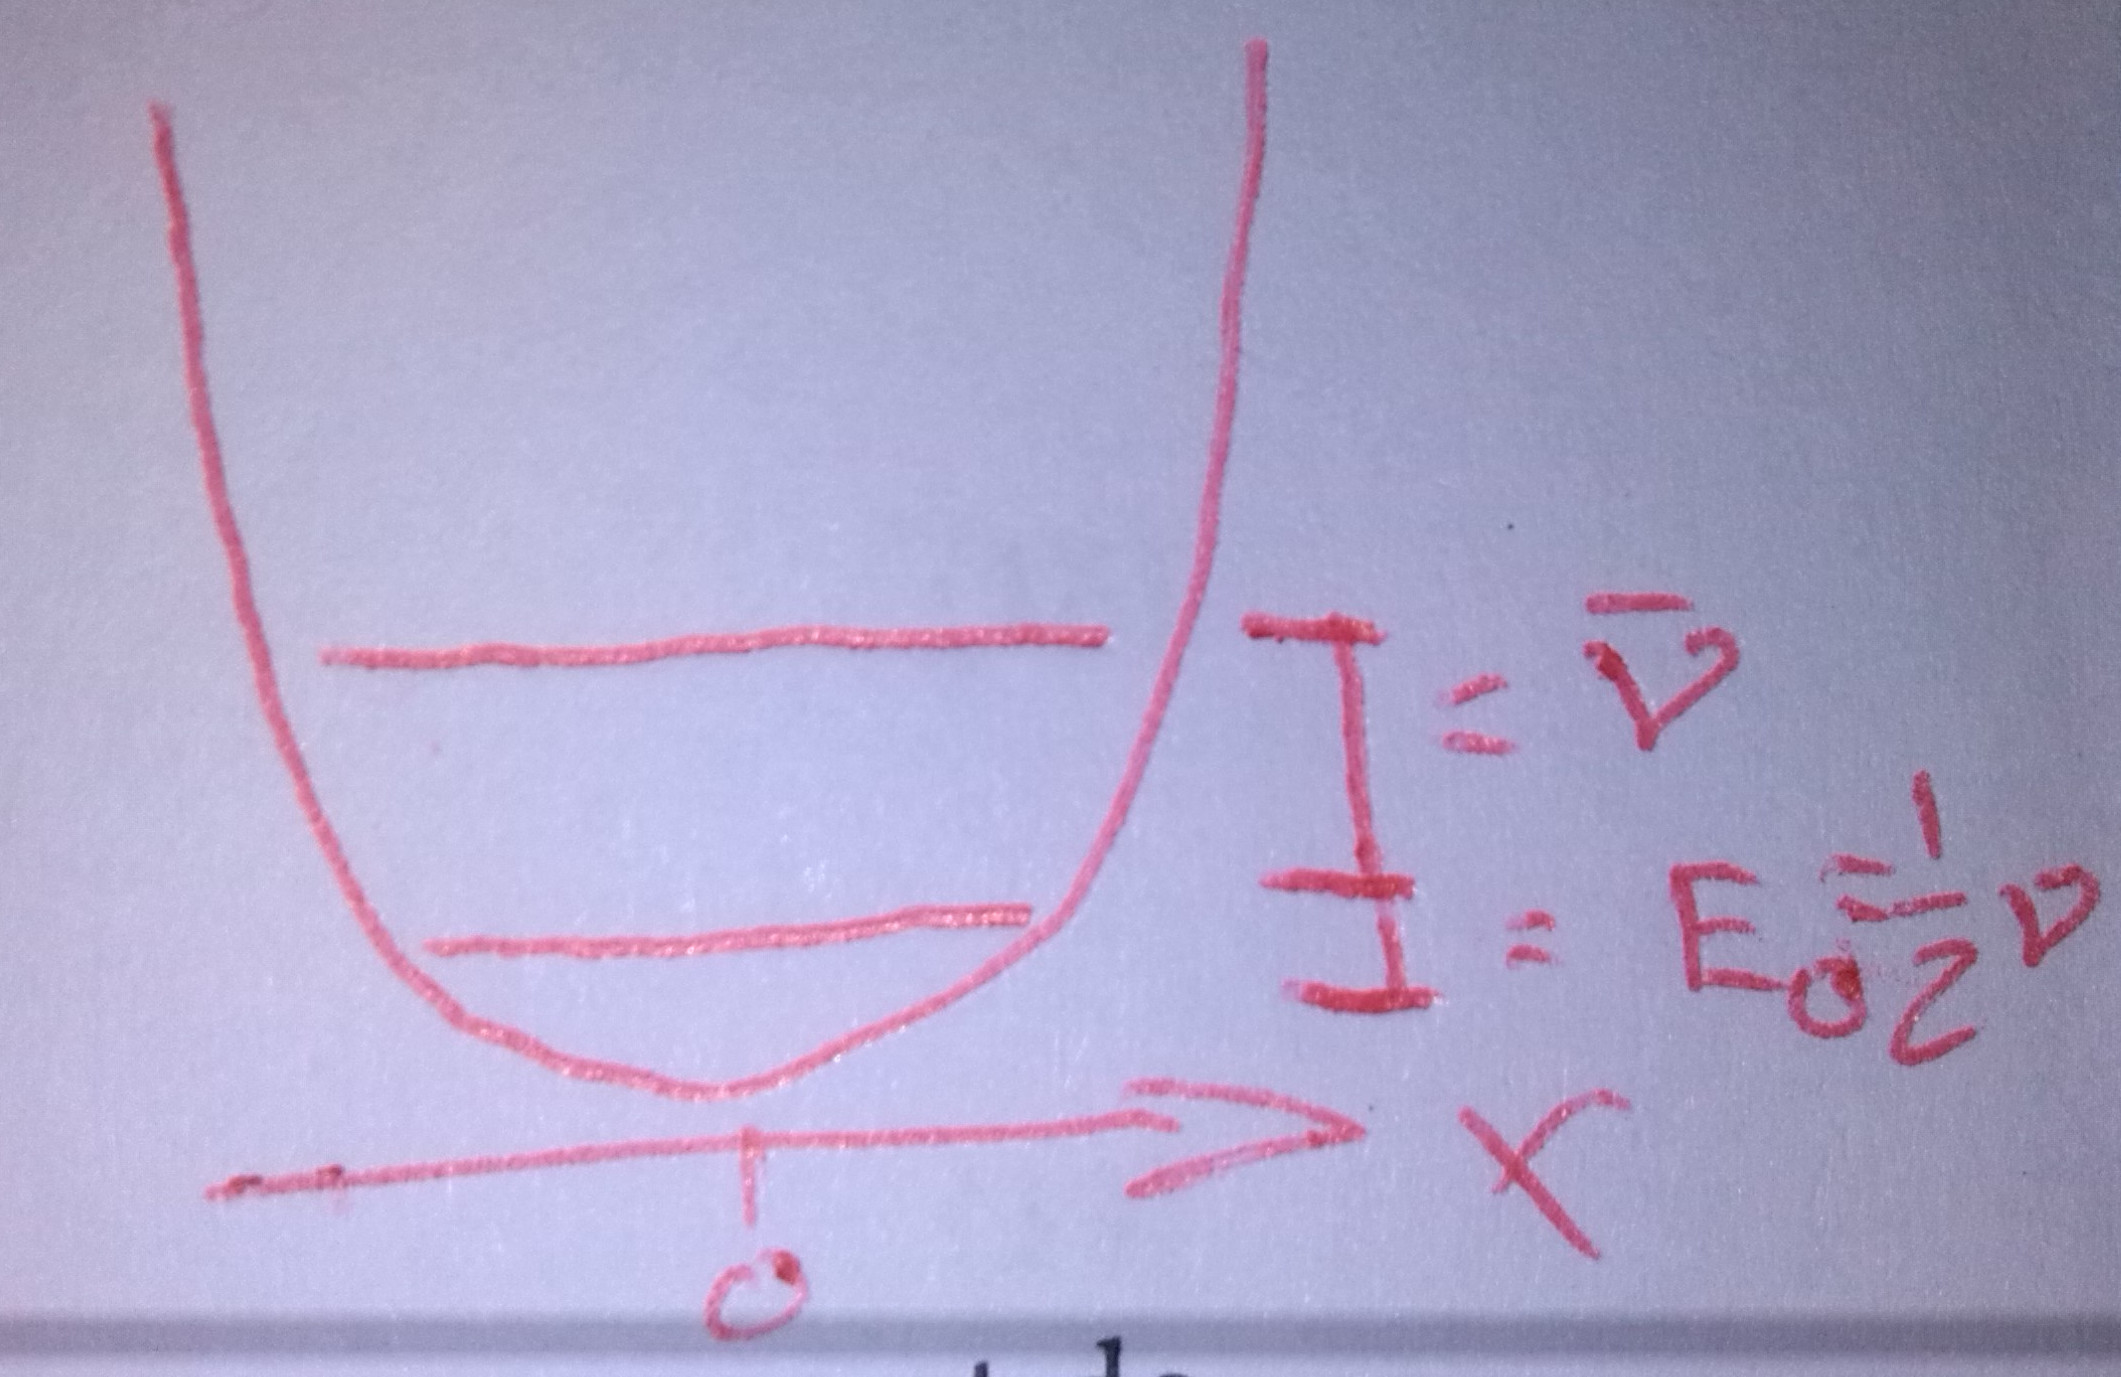
Vielleicht könnt ihr mir ja weiterhelfen? Es sollte gerne so hier aussehen:
Hier was ich bis jetzt erreicht habe: \documentclass{article} \usepackage{tikz} \begin{document} \begin{tikzpicture} \draw[thick,->] (1,0) -- (8,0); \draw[thick,->] (0,1) -- (0,8); \draw [thick, black] plot [smooth] coordinates {(1.5, 7.5) (2,5) (3, 2) (4.5,1) (6,2) (7, 5) (7.5, 7.5)}; \draw [black] (3,2) -- (6,2); \draw [black] (2,5) -- (7,5); \end{tikzpicture} \end{document} Was fehlt ist 1. die Nullstelle (wie auf der Zeichnung) zu beschriften und zweitens die zwei Niveaus zu markieren (mit diesen großen I's) und mathematisch zu zeigen. |
|
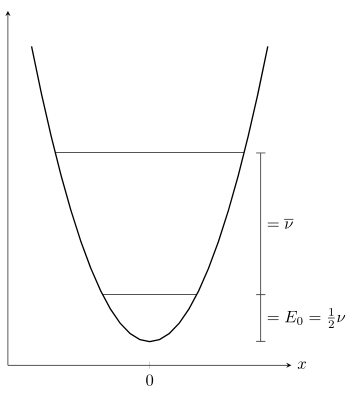
Hier ist ein Vorschlag mit \documentclass[margin=10pt]{standalone} \usepackage{pgfplots} \pgfplotsset{compat=1.11} \begin{document} \begin{tikzpicture} \begin{axis}[ axis lines=left, x=1cm,y=1cm, domain=-2.5:2.5, xtick={0},xmin=-3,xmax=3,xlabel={$x$},xlabel style={right,at={(1,0)}}, ytick=\empty,ymin=-.5,ymax=7, no markers, clip=false, ] \addplot[black,thick]{x^2}; \addplot[black]coordinates{(-1,1)(1,1)}coordinate(h1); \addplot[black]coordinates{(-2,4)(2,4)}coordinate[xshift=1em](h2); \draw[|-](h2)--node[right]{$=\overline{\nu}$}(h2|-h1); \draw[|-|](h2|-h1)--node[right]{$=E_0=\frac{1}{2}\nu$}(h2|-0,0); \end{axis} \end{tikzpicture} \end{document}
Vielen Dank!
(06 Dez '14, 12:07)
Basilius Sap...
|