|
Hallo allerseits, ich bin aktuell dabei meine Tabellen meiner Thesis zu hübschen. Ich bin ein blutiger Anfänger was Latex betrifft und klicke mir meinen Code aus verschiedenen Schnipseln zusammen, so weit so gut. Jetzt hätte ich gerne meine Daten am plus/minus Zeichen ausgerichtet und sie quasi daran ausgerichtet aber das Rubber-banding von extracolsep zerwerkelt mir die Spalten. Jemand ne Idee? Ich nutze das ganze in overleaf. Öffne in Overleaf
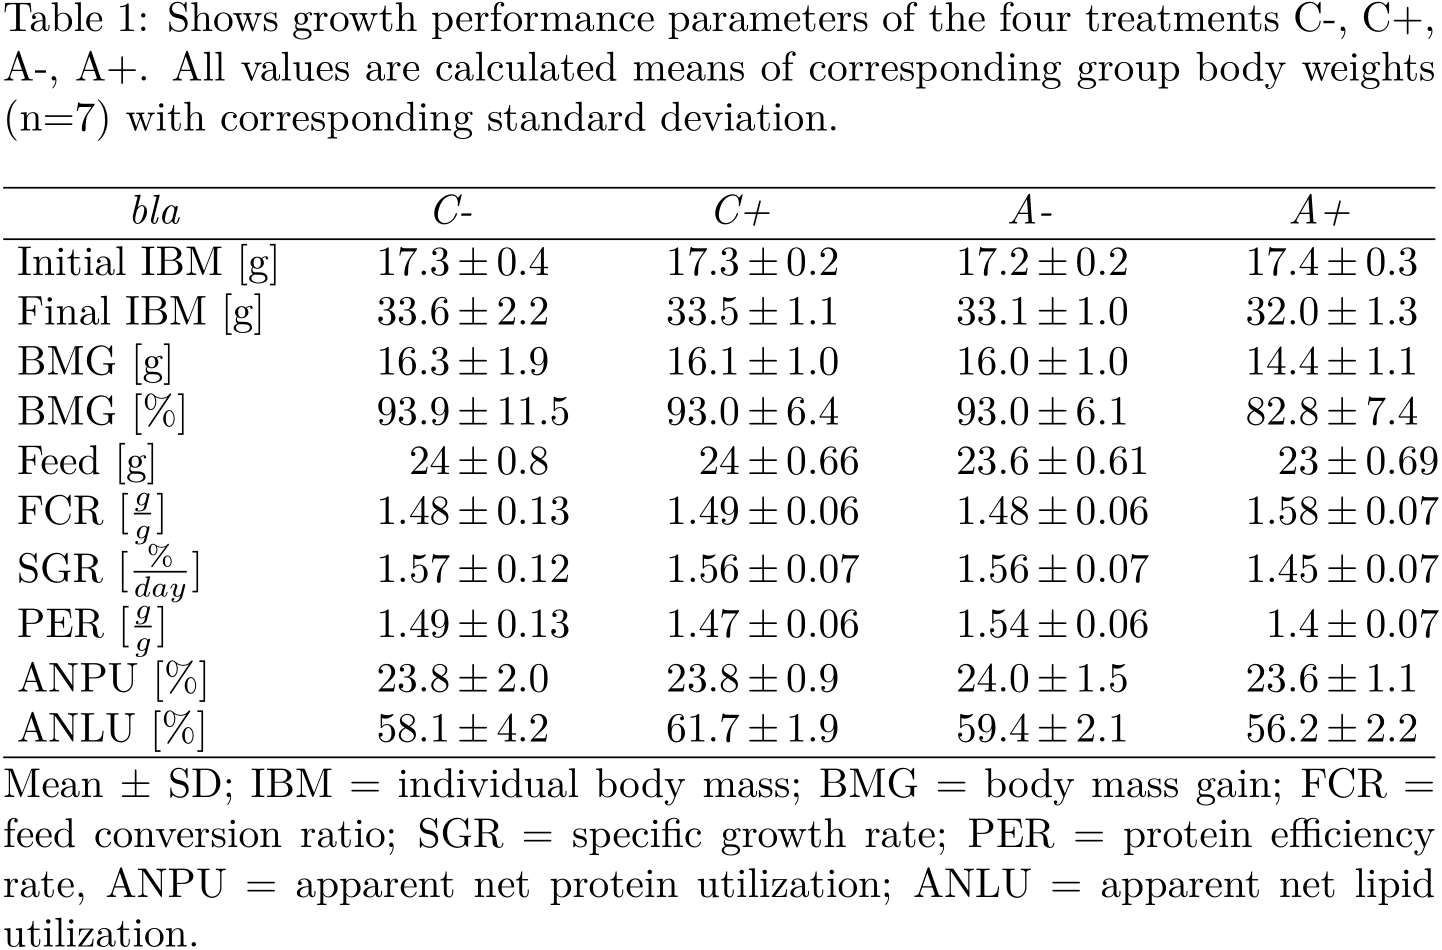
\begin{table} \caption{Shows growth performance parameters of the four treatments C-, C+, A-, A+. All values are calculated means of corresponding group body weights (n=7) with corresponding standard deviation.} \begin{tabular*}{\textwidth} {@{\extracolsep{\fill} } l r@{$\pm$} l r@{$\pm$}l r@{$\pm$}l r@{$\pm$}l} \hline \multicolumn{1}{c}{\textit{bla}} & \multicolumn{2}{c}{\textit{C-}} & \multicolumn{2}{c}{\textit{C+}} & \multicolumn{2}{c}{\textit{A-}} & \multicolumn{2}{c}{\textit{A+}}\\ % & & C- & & C+ & &A- & &A+ \\ \hline Initial IBM [g] & 17.3&0.4 & 17.3&0.2 & 17.2&0.2 & 17.4&0.3 \\ Final IBM [g] & 33.6&2.2 & 33.5&1.1 & 33.1&1.0 & 32.0&1.3 \\ BMG [g] & 16.3&1.9 & 16.1&1.0 & 16.0&1.0 & 14.4&1.1 \\ BMG [\%] & 93.9&11.5 & 93.0&6.4 & 93.0&6.1 & 82.8&7.4 \\ Feed [g] & 24&0.8 & 24&0.66 & 23.6&0.61 & 23&0.69 \\ FCR [$ \frac{g} {g}$] & 1.48&0.13 & 1.49&0.06 & 1.48&0.06 & 1.58&0.07 \\ SGR [$ \frac{\%} {day}$] & 1.57&0.12 & 1.56&0.07 & 1.56&0.07 & 1.45&0.07 \\ PER [$ \frac{g} {g}$] & 1.49&0.13 & 1.47&0.06 & 1.54&0.06 & 1.4&0.07 \\ ANPU [\%] & 23.8&2.0 & 23.8&0.9 & 24.0&1.5 & 23.6&1.1 \\ ANLU [\%] & 58.1&4.2 &61.7&1.9 & 59.4&2.1 & 56.2&2.2 \\\hline \end{tabular*} \caption*{Mean $\pm$ SD; IBM = individual body mass; BMG = body mass gain; FCR = feed conversion ratio; SGR = specific growth rate; PER = protein efficiency rate, ANPU = apparent net protein utilization; ANLU = apparent net lipid utilization.} \label{table:growthperformance} \end {table} %\end{center} |
|
Du könntest Öffne in Overleaf
\documentclass{article}
\usepackage{caption} % for \caption*
\usepackage{dcolumn}
\newcolumntype{d}{D{+}{\,\pm\,}{-1}}
\begin{document}
\begin{table}
  \caption{Shows growth performance parameters of the four treatments C-, C+, A-, A+. All values are calculated means of corresponding group body weights (n=7) with corresponding standard deviation.}

  \begin{tabular*}{\textwidth} {@{\extracolsep{\fill} } l d d d d}
    \hline
    \multicolumn{1}{c}{\textit{bla}}
    & \multicolumn{1}{c}{\textit{C-}}
    & \multicolumn{1}{c}{\textit{C+}}
    & \multicolumn{1}{c}{\textit{A-}}
    & \multicolumn{1}{c}{\textit{A+}}\\
    % &                          & C-      & & C+   & &A-   & &A+  \\

    \hline
    Initial IBM [g]          & 17.3 + 0.4  & 17.3 + 0.2  & 17.2 + 0.2  & 17.4 + 0.3  \\
    Final IBM [g]            & 33.6 + 2.2  & 33.5 + 1.1  & 33.1 + 1.0  & 32.0 + 1.3  \\
    BMG [g]                  & 16.3 + 1.9  & 16.1 + 1.0  & 16.0 + 1.0  & 14.4 + 1.1  \\
    BMG [\%]                 & 93.9 + 11.5 & 93.0 + 6.4  & 93.0 + 6.1  & 82.8 + 7.4  \\
    Feed [g]                 & 24   + 0.8  & 24   + 0.66 & 23.6 + 0.61 & 23   + 0.69 \\
    FCR [$ \frac{g} {g}$]    & 1.48 + 0.13 & 1.49 + 0.06 & 1.48 + 0.06 & 1.58 + 0.07 \\
    SGR [$ \frac{\%} {day}$] & 1.57 + 0.12 & 1.56 + 0.07 & 1.56 + 0.07 & 1.45 + 0.07 \\
    PER [$ \frac{g} {g}$]    & 1.49 + 0.13 & 1.47 + 0.06 & 1.54 + 0.06 & 1.4  + 0.07 \\
    ANPU [\%]                & 23.8 + 2.0  & 23.8 + 0.9  & 24.0 + 1.5  & 23.6 + 1.1  \\
    ANLU [\%]                & 58.1 + 4.2  & 61.7 + 1.9  & 59.4 + 2.1  & 56.2 + 2.2  \\
    \hline

  \end{tabular*}
  \caption*{Mean $\pm$ SD; IBM = individual body mass; BMG = body mass gain; FCR = feed conversion ratio; SGR = specific growth rate; PER = protein efficiency rate, ANPU = apparent net protein utilization; ANLU = apparent net lipid utilization.}
  \label{table:growthperformance}
\end {table}
\end{document}
Eine andere Möglichkeit wäre den Öffne in Overleaf
\documentclass{article}
\usepackage{caption} % for \caption*
\begin{document}
\begin{table}
  \caption{Shows growth performance parameters of the four treatments C-, C+, A-, A+. All values are calculated means of corresponding group body weights (n=7) with corresponding standard deviation.}

  \begin{tabular*}{\textwidth}{
    @{\extracolsep{\fill}} l
    @{\extracolsep{\fill}} r@{\extracolsep{0pt}$\pm$}l
    @{\extracolsep{\fill}} r@{\extracolsep{0pt}$\pm$}l
    @{\extracolsep{\fill}} r@{\extracolsep{0pt}$\pm$}l
    @{\extracolsep{\fill}} r@{\extracolsep{0pt}$\pm$}l
    }
    \hline
    \multicolumn{1}{c}{\textit{bla}}
    & \multicolumn{2}{c}{\textit{C-}}
    & \multicolumn{2}{c}{\textit{C+}}
    & \multicolumn{2}{c}{\textit{A-}}
    & \multicolumn{2}{c}{\textit{A+}}\\
    % &                          & C-      & & C+   & &A-   & &A+  \\

    \hline
    Initial IBM [g]          & 17.3 & 0.4  & 17.3 & 0.2  & 17.2 & 0.2  & 17.4 & 0.3  \\
    Final IBM [g]            & 33.6 & 2.2  & 33.5 & 1.1  & 33.1 & 1.0  & 32.0 & 1.3  \\
    BMG [g]                  & 16.3 & 1.9  & 16.1 & 1.0  & 16.0 & 1.0  & 14.4 & 1.1  \\
    BMG [\%]                 & 93.9 & 11.5 & 93.0 & 6.4  & 93.0 & 6.1  & 82.8 & 7.4  \\
    Feed [g]                 & 24   & 0.8  & 24   & 0.66 & 23.6 & 0.61 & 23   & 0.69 \\
    FCR [$ \frac{g} {g}$]    & 1.48 & 0.13 & 1.49 & 0.06 & 1.48 & 0.06 & 1.58 & 0.07 \\
    SGR [$ \frac{\%} {day}$] & 1.57 & 0.12 & 1.56 & 0.07 & 1.56 & 0.07 & 1.45 & 0.07 \\
    PER [$ \frac{g} {g}$]    & 1.49 & 0.13 & 1.47 & 0.06 & 1.54 & 0.06 & 1.4  & 0.07 \\
    ANPU [\%]                & 23.8 & 2.0  & 23.8 & 0.9  & 24.0 & 1.5  & 23.6 & 1.1  \\
    ANLU [\%]                & 58.1 & 4.2  & 61.7 & 1.9  & 59.4 & 2.1  & 56.2 & 2.2  \\
    \hline

  \end{tabular*}
  \caption*{Mean $\pm$ SD; IBM = individual body mass; BMG = body mass gain; FCR = feed conversion ratio; SGR = specific growth rate; PER = protein efficiency rate, ANPU = apparent net protein utilization; ANLU = apparent net lipid utilization.}
  \label{table:growthperformance}
\end {table}
\end{document}
Die Ausgabe sieht ungefähr gleich aus. Die erste Option bringt bei mir noch einen kleinen Abstand zum plus/minus Zeichen aber die zweite Option bringt das gewünschte Ergebniss! Vielen lieben Dank!
(13 Jan '19, 14:22)
this_dude
2
@this_dude Der kleine Abstand dürfte beabsichtigt sein und von den
(13 Jan '19, 18:55)
gast3
|