
|
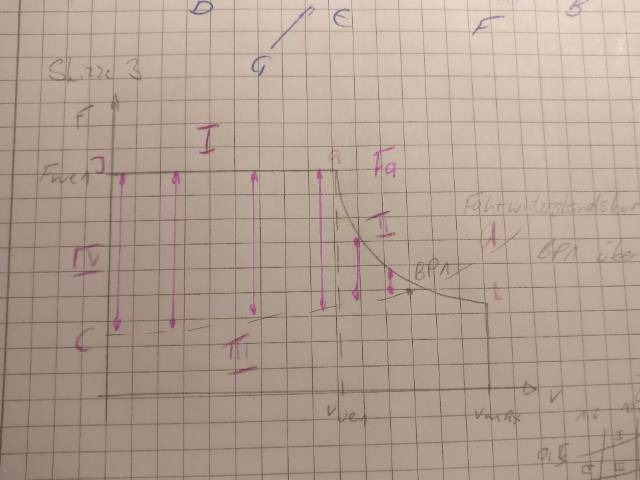
Hallo zusammen, meine Skizze enthält eine Fläche (im Minimalbeispiel grau eingefärbt), die ich gerne mit gleichmäßig verteilten Pfeilen parallel zur y-Achse mit einem beliebigen Abstand füllen würde. Es geht quasi darum, die Kraftänderung zwischen den beiden Kurven darzustellen. Ich würde mich sehr freuen, wenn jemand von euch eine Lösungsidee hätte! \documentclass[tikz, border=5pt]{standalone} \usepackage{tikz} \usetikzlibrary{backgrounds} \usepackage{pgfplots} \pgfplotsset{compat=newest} \usetikzlibrary{ arrows, decorations.pathreplacing, shapes.symbols, angles, quotes, calc } \usepgfplotslibrary{fillbetween} \begin{document} \begin{tikzpicture} \pgfdeclarelayer{pre main} \pgfsetlayers{pre main,main} % Koordinatensystem \coordinate (A) at (0, 0) {}; \coordinate (B) at (10, 0) {}; \coordinate (C) at (0, 9) {}; \coordinate (D) at (4, 0) {}; \coordinate (E) at (8, 0) {}; \coordinate (I) at (0, 6) {}; \coordinate (a) at (4, 6) {}; \coordinate (b) at (8, 3) {}; \coordinate (c) at (0, 2) {}; \coordinate (d) at (9, 5) {}; % Koordinatensystempfeile \draw[->,line width=0.4mm] (A) -- (B) node[below] {$v$}; \draw[->,line width=0.4mm,name path=AtoC] (A) -- (C) node[left] {$F_\mathrm{T}$}; % Koordinatenstriche \draw[-,line width=0.4mm] (D) -- (4, -0.1) node[below] {$v_\mathrm{ue1}$}; \draw[-,line width=0.4mm] (E) -- (8, -0.1) node[below] {$v_\mathrm{max}$}; \draw[-,line width=0.4mm] (I) -- (-0.1, 6) node[left] {$F_\mathrm{vue1}$}; % Verbindungslinien \draw[dotted] (D) -- (a); % Graphen \draw[name path=KurveI] (I) -- (a); \draw[name path=KurveII,bend left=20] (b) to (a); \draw[name path=KurveIII,dotted,bend left=20](d) to (c); \path [%draw,line width=3,blue, name path=IandIV, intersection segments={ of=KurveI and AtoC, sequence={A1 -- B0[reverse]} }]; \path [%draw,line width=3,blue, name path=IIIandII, intersection segments={ of=KurveIII and KurveII, sequence={A1[reverse] -- B1} }]; \pgfonlayer{pre main} \fill [ gray!20, intersection segments={ of=IandIV and IIIandII, sequence={A1 -- B1[reverse]}, } ]; \endpgfonlayer \end{tikzpicture} \end{document}
|
|
Ein Grossteil dieser Antwort stammt aus dieser Antwort. Alles was zu tun war, war zwei "neue" Pfade zu definieren.
\documentclass[tikz, border=5pt]{standalone}
\usepackage{tikz}
\usepackage{xparse}
\usetikzlibrary{backgrounds}
\usepackage{pgfplots}
\pgfplotsset{compat=newest}
\usetikzlibrary{
  arrows,
  decorations.pathreplacing,
  shapes.symbols,
  angles,
  quotes,
  calc,
  arrows.meta
}
\usepgfplotslibrary{fillbetween}

\NewDocumentCommand\DrawArrows{O{0.5}mmO{-latex}mm}{
\def\Step{#1}
\pgfmathsetmacro{\Second}{#5+\Step}
\foreach \Value [count=\xi] in {#5,\Second,...,#6}
  {
  \path[overlay,name path=line\xi]
    (\Value,100) -- (\Value,-100);
  \path[name intersections={of=#2 and line\xi,by={1\xi}}];
  \path[name intersections={of=#3 and line\xi,by={2\xi}}];
  \ifdim#5pt<\Value pt\relax
    \ifdim\Value pt<#6pt\relax
    \draw[#4]
      (1\xi) -- (2\xi);
  \fi\fi
  }
}

\begin{document}

    \begin{tikzpicture}
  \pgfdeclarelayer{pre main}
  \pgfsetlayers{pre main,main}
  % Koordinatensystem
  \coordinate (A) at (0, 0) {};
  \coordinate (B) at (10, 0) {};
  \coordinate (C) at (0, 9) {};
  \coordinate (D) at (4, 0) {};
  \coordinate (E) at (8, 0) {};
  \coordinate (I) at (0, 6) {};
  \coordinate (a) at (4, 6) {};
  \coordinate (b) at (8, 3) {};
  \coordinate (c) at (0, 2) {};
  \coordinate (d) at (9, 5) {};
  % Koordinatensystempfeile
  \draw[->,line width=0.4mm] (A) -- (B) node[below] {$v$};
  \draw[->,line width=0.4mm,name path=AtoC] (A) -- (C) node[left] {$F_\mathrm{T}$};
  % Koordinatenstriche
  \draw[-,line width=0.4mm] (D) -- (4, -0.1) node[below] {$v_\mathrm{ue1}$};
  \draw[-,line width=0.4mm] (E) -- (8, -0.1) node[below] {$v_\mathrm{max}$};
  \draw[-,line width=0.4mm] (I) -- (-0.1, 6) node[left] {$F_\mathrm{vue1}$};
  % Verbindungslinien
  \draw[dotted,name path=Dtoa] (D) -- (a);
  % Graphen
  \draw[name path=KurveI] (I) -- (a);
  \draw[name path=KurveII,bend left=20] (b) to (a);
  \draw[name path=KurveIII,dotted,bend left=20](d) to (c);

    \path [%draw,line width=3,blue,
    name path=IandIV,
    intersection segments={
        of=KurveI and AtoC,
        sequence={A1 -- B0[reverse]}
    }];

  \path [%draw,line width=3,blue,
    name path=IIIandII,
    intersection segments={
        of=KurveIII and KurveII,
        sequence={A1[reverse] -- B1}
    }];
   \path [%draw,line width=3,blue,
    name path=links,
    intersection segments={
        of=KurveIII and Dtoa,
        sequence={A1}
    }];

   \path [%draw,line width=3,blue,
    name path=rechts,
    intersection segments={
        of=KurveIII and Dtoa,
        sequence={A0}
    }];

  \pgfonlayer{pre main}
\DrawArrows[0.25]{KurveI}{links}[Stealth-Stealth,cyan]{0}{4.2}
\DrawArrows[0.25]{KurveII}{rechts}[Stealth-Stealth,cyan]{4}{6.7}
  \endpgfonlayer

\end{tikzpicture}

\end{document}
Der etwas unschöne Punkt an dem Macro Sehr schoen geloest, vielen Dank!
(05 Apr '18, 23:09)
FMinister
|

