|
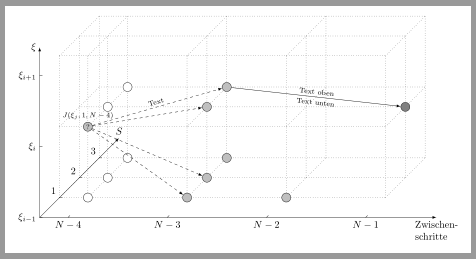
Ich würde gerne an meinem 3D-Plot eigene Ticks verwenden, also anstatt einer "3" hätte ich gerne "N+1" usw. Wie kann ich das machen? Und ich würde gerne ein Sonderzeichen als Beschriftung einer anderen Achse verwenden(griechiche xi) , finde dazu jedoch nichts. Mein Code. \begin{figure}[H] \begin{tikzpicture}[x={(0.7cm,0.7cm)},y={(1cm,0cm)}, z={(0cm,1cm)}] \draw[->, >=latex] (0,0,0) -- (4,0,0) node[above]{$S$}; \draw[->, >=latex] (0,0,0) -- (0,14,0) node[below]{$y$}; \draw[->, >=latex] (0,0,0) -- (0,0,6) node[left]{$z$}; \draw [dotted] plot[] coordinates{(1,1,0)(2,1,0)(3,1,0)}; \draw [dotted] plot[] coordinates{(1,1,2.5)(2,1,2.5)(3,1,2.5)}; \draw [dotted] plot[] coordinates{(1,1,5)(2,1,5)(3,1,5)}; \draw [dotted] plot[] coordinates{(1,4.5,0)(2,4.5,0)(3,4.5,0)}; \draw [dotted] plot[] coordinates{(1,4.5,2.5)(2,4.5,2.5)(3,4.5,2.5)}; \draw [dotted] plot[] coordinates{(1,4.5,5)(2,4.5,5)(3,4.5,5)}; \draw [dotted] plot[] coordinates{(1,8,0)(2,8,0)(3,8,0)}; \draw [dotted] plot[] coordinates{(1,8,2.5)(2,8,2.5)(3,8,2.5)}; \draw [dotted] plot[] coordinates{(1,8,5)(2,8,5)(3,8,5)}; \draw [dotted] plot[] coordinates{(1,1,0)(1,1,2.5)(1,1,5)}; \draw [dotted] plot[] coordinates{(2,1,0)(2,1,2.5)(2,1,5)}; \draw [dotted] plot[] coordinates{(3,1,0)(3,1,2.5)(3,1,5)}; \draw [dotted] plot[] coordinates{(1,4.5,0)(1,4.5,2.5)(1,4.5,5)}; \draw [dotted] plot[] coordinates{(2,4.5,0)(2,4.5,2.5)(2,4.5,5)}; \draw [dotted] plot[] coordinates{(3,4.5,0)(3,4.5,2.5)(3,4.5,5)}; \draw [dotted] plot[] coordinates{(1,8,0)(1,8,2.5)(1,8,5)}; \draw [dotted] plot[] coordinates{(2,8,0)(2,8,2.5)(2,8,5)}; \draw [dotted] plot[] coordinates{(3,8,0)(3,8,2.5)(3,8,5)}; \draw [dotted] plot[] coordinates{(1,11.5,0)(1,11.5,2.5)(1,11.5,5)};%high \draw [dotted] plot[] coordinates{(2,11.5,0)(2,11.5,2.5)(2,11.5,5)}; \draw [dotted] plot[] coordinates{(3,11.5,0)(3,11.5,2.5)(3,11.5,5)}; \draw [dotted] plot[] coordinates{(1,0,0)(1,11.5,0)}; % horizontal \draw [dotted] plot[] coordinates{(2,0,0)(2,11.5,0)}; \draw [dotted] plot[] coordinates{(3,0,0)(3,11.5,0)}; \draw [dotted] plot[] coordinates{(1,0,2.5)(1,11.5,2.5)}; \draw [dotted] plot[] coordinates{(2,0,2.5)(2,11.5,2.5)}; \draw [dotted] plot[] coordinates{(3,0,2.5)(3,11.5,2.5)}; \draw [dotted] plot[] coordinates{(1,0,5)(1,11.5,5)}; \draw [dotted] plot[] coordinates{(2,0,5)(2,11.5,5)}; \draw [dotted] plot[] coordinates{(3,0,5)(3,11.5,5)}; \draw [dotted] plot[] coordinates{(1,0,2.5)(3,0,2.5)}; \draw [dotted] plot[] coordinates{(1,0,5)(3,0,5)}; \draw [dotted] plot[] coordinates{(1,0,0)(1,0,5)}; \draw [dotted] plot[] coordinates{(2,0,0)(2,0,5)}; \draw [dotted] plot[] coordinates{(3,0,0)(3,0,5)}; \draw [dotted] plot[] coordinates{(1,11.5,0)(3,11.5,0)}; \draw [dotted] plot[] coordinates{(1,11.5,2.5)(3,11.5,2.5)}; \draw [dotted] plot[] coordinates{(1,11.5,5)(3,11.5,5)}; \shadedraw plot [only marks, mark=*, mark size=4.5pt, mark options={fill=gray}] coordinates{ (1,1,0)(2,1,0)(3,1,0) %y1 (1,1,2.5)(2,1,2.5)(3,1,2.5) (1,1,5)(2,1,5)(3,1,5) (1,4.5,0)(2,4.5,0)(3,4.5,0) % y2 (1,4.5,2.5)(2,4.5,2.5)(3,4.5,2.5) (1,4.5,5)(2,4.5,5)(3,4.5,5) (1,8,0)(2,8,0)(3,8,0) % y3 (1,8,2.5)(2,8,2.5)(3,8,2.5) (1,8,5)(2,8,5)(3,8,5) (2,11.5,2.5) }; \end{tikzpicture} \caption{3D-DDP} \label{img:3D-DDP} \end{figure} Ich würde gerne hier hin kommen: Zum Schluss bleiben nur noch die Pfeile, wobei ich da nur nicht weiß, wie ich diese beschriften kann. |
|
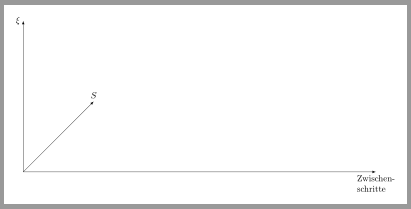
Du kannst doch einfach das \documentclass[tikz,margin=10pt]{standalone} \begin{document} \begin{tikzpicture}[>=latex,x={(0.7cm,0.7cm)},y={(1cm,0cm)}, z={(0cm,1cm] % Achsen \draw[->] (0,0,0) -- (4,0,0) node[above]{$S$}; \draw[->] (0,0,0) -- (0,14,0) node[below,align=left]{Zwischen-\\schritte}; \draw[->] (0,0,0) -- (0,0,6) node[left]{$\xi$}; \end{tikzpicture} \end{document}
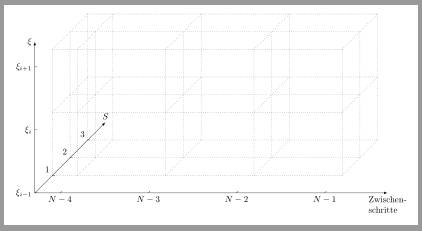
Hier ist mal noch ein Vorschlag für den Rest: Um die Achsen einzuteilen und das Gitter zu zeichnen, würde ich % Achseneinteilung \newcommand\xcoords{{1,2,3}}\newcommand\imax{2} \newcommand\ycoords{{0,1,4.5,8,11.5}}\newcommand\jmax{4} \newcommand\zcoords{{0,2.5,5}}\newcommand\kmax{2} Die Ticks und Gitter kann ich dann wie folgt einzeichnen % Ticks mit Beschriftung \foreach[evaluate={\x=\xcoords[\i]}] \i in {0,...,\imax} \draw(\x,0.1,0)--(\x,0,0)node[above left]{\x}; \foreach[evaluate={\y=\ycoords[\j]},evaluate={\n=int(\jmax+1-\j)}]\j in {1,...,\jmax} \draw(0.1,\y,0)--(0,\y,0)node[below]{$N-\n$}; \foreach[count=\k from 0,evaluate={\z=\zcoords[\k]}]\t in {% $\xi_{i-1}$,$\xi_{i}$,$\xi_{i+1}$% }\draw (0,0.1,\z)--(0,0,\z)node [left]{\t}; % Gitterlinien \foreach[evaluate={ \x=\xcoords[\i]},evaluate={\zmin=\zcoords[0]},evaluate={\zmax=\zcoords[\kmax]} ] \i in {0,...,\imax} \foreach[evaluate={\y=\ycoords[\j]}] \j in {0,...,\jmax} \draw[dotted](\x,\y,\zmin)--(\x,\y,\zmax); \foreach[evaluate={ \x=\xcoords[\i]},evaluate={\ymin=\ycoords[0]},evaluate={\ymax=\ycoords[\jmax]} ] \i in {0,...,\imax} \foreach[evaluate={\z=\zcoords[\k]}] \k in {0,...,\kmax} \draw[dotted](\x,\ymin,\z)--(\x,\ymax,\z); \foreach[evaluate={\y=\ycoords[\j]}] \j in {0,...,\jmax} \foreach[evaluate={ \z=\zcoords[\k]},evaluate={\xmin=\xcoords[0]},evaluate={\xmax=\xcoords[\imax]} ] \k in {0,...,\kmax} \draw[dotted](\xmin,\y,\z)--(\xmax,\y,\z);
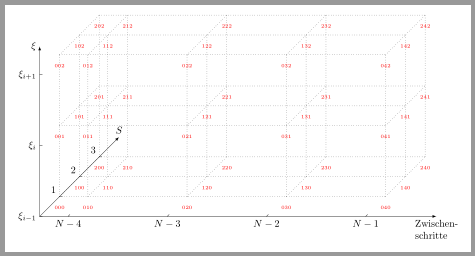
Um die Punkte später einfach platzieren zu können, definiere ich mir für jeden Gitterpunkt eine % Gitterpunkte benennen \foreach[evaluate={\x=\xcoords[\i]}] \i in {0,...,\imax} \foreach[evaluate={\y=\ycoords[\j]}] \j in {0,...,\jmax} \foreach[evaluate={\z=\zcoords[\k]}] \k in {0,...,\kmax} \coordinate[nummer=\i\j\k](c\i\j\k)at(\x,\y,\z); Der Name besteht dabei aus einem c gefolgt von einer Zahl. Damit ich den Überblick behalte, schaffe ich mir eine Möglichkeit die Zahlen anzuzeigen: \begin{tikzpicture}[ ... nummer/.style={}, %% Zum Einblenden der Koordinatennummern nummer/.style={label={[red,font=\tiny,label distance=2mm]below:#1}} ] %% Zum Einblenden der Koordinatennummern \tikzset{nummer/.style={label={[red,font=\tiny,label distance=2mm]below:#1}}}
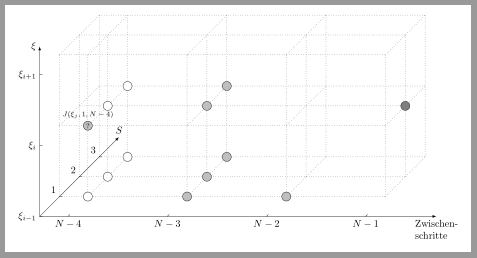
Für die Punkte verwende ich benannte Kreisnoden, weil diese sich später besser verbinden lassen. Als Namen verwende ich die gleichen Zahlen, aber mit einem p statt einem c vor dieser. Außerdem definiere ich mir einen Stil für die Nodes. % Punkte einzeichnen \foreach \p in {010,110,210,111,211} \node[punkt](p\p)at(c\p){}; \node[punkt=lightgray,label=above:{$J(\xi_{j},1,N-4)$}](p011)at(c011){?}; \foreach \p in { 020,120,220, 121,221, 030% }\node[punkt=lightgray](p\p)at(c\p){}; \node[punkt=gray](p141)at(c141){}; und begin{tikzpicture}[ ... punkt/.style={circle,draw,fill=#1,inner sep=0pt,minimum size=9pt}, punkt/.default=white, ... ]
Diese Noden lassen sich jetzt einfach verbinden: \begin{scope}[->] \foreach \p in {020,120,121} \draw[dashed](p011)--(p\p); \draw[dashed](p011)--node[sloped,above]{Text}(p221); \draw(p221)--node[sloped,above]{Text oben}node[sloped,below]{Text unten}(p141); \end{scope}
Code: \documentclass[tikz,margin=10pt]{standalone} \begin{document} \begin{tikzpicture}[>=latex, x={(0.7cm,0.7cm)},y={(1cm,0cm)}, z={(0cm,1cm)}, punkt/.style={circle,draw,fill=#1,inner sep=0pt,minimum size=9pt}, punkt/.default=white, nummer/.style={}, %% Zum Einblenden der Koordinatennummern %nummer/.style={label={[red,font=\tiny,label distance=2mm]below:#1}} ] % Achsen \draw[->] (0,0,0) -- (4,0,0) node[above]{$S$}; \draw[->] (0,0,0) -- (0,14,0) node[below,align=left]{Zwischen-\\schritte}; \draw[->] (0,0,0) -- (0,0,6) node[left]{$\xi$}; % Achseneinteilung \newcommand\xcoords{{1,2,3}}\newcommand\imax{2} \newcommand\ycoords{{0,1,4.5,8,11.5}}\newcommand\jmax{4} \newcommand\zcoords{{0,2.5,5}}\newcommand\kmax{2} % Ticks mit Beschriftung \foreach[evaluate={\x=\xcoords[\i]}] \i in {0,...,\imax} \draw(\x,0.1,0)--(\x,0,0)node[above left]{\x}; \foreach[evaluate={\y=\ycoords[\j]},evaluate={\n=int(\jmax+1-\j)}]\j in {1,...,\jmax} \draw(0.1,\y,0)--(0,\y,0)node[below]{$N-\n$}; \foreach[count=\k from 0,evaluate={\z=\zcoords[\k]}]\t in {% $\xi_{i-1}$,$\xi_{i}$,$\xi_{i+1}$% }\draw (0,0.1,\z)--(0,0,\z)node [left]{\t}; % Gitterlinien \foreach[evaluate={ \x=\xcoords[\i]},evaluate={\zmin=\zcoords[0]},evaluate={\zmax=\zcoords[\kmax]} ] \i in {0,...,\imax} \foreach[evaluate={\y=\ycoords[\j]}] \j in {0,...,\jmax} \draw[dotted](\x,\y,\zmin)--(\x,\y,\zmax); \foreach[evaluate={ \x=\xcoords[\i]},evaluate={\ymin=\ycoords[0]},evaluate={\ymax=\ycoords[\jmax]} ] \i in {0,...,\imax} \foreach[evaluate={\z=\zcoords[\k]}] \k in {0,...,\kmax} \draw[dotted](\x,\ymin,\z)--(\x,\ymax,\z); \foreach[evaluate={\y=\ycoords[\j]}] \j in {0,...,\jmax} \foreach[evaluate={ \z=\zcoords[\k]},evaluate={\xmin=\xcoords[0]},evaluate={\xmax=\xcoords[\imax]} ] \k in {0,...,\kmax} \draw[dotted](\xmin,\y,\z)--(\xmax,\y,\z); % Gitterpunkte benennen \foreach[evaluate={\x=\xcoords[\i]}] \i in {0,...,\imax} \foreach[evaluate={\y=\ycoords[\j]}] \j in {0,...,\jmax} \foreach[evaluate={\z=\zcoords[\k]}] \k in {0,...,\kmax} \coordinate[nummer=\i\j\k](c\i\j\k)at(\x,\y,\z); %%% ------------------------------------------------------------------------------- \begin{scope}[node font=\scriptsize] % Punkte einzeichnen \foreach \p in {010,110,210,111,211} \node[punkt](p\p)at(c\p){}; \node[punkt=lightgray,label=above:{$J(\xi_{j},1,N-4)$}](p011)at(c011){?}; \foreach \p in { 020,120,220, 121,221, 030% }\node[punkt=lightgray](p\p)at(c\p){}; \node[punkt=gray](p141)at(c141){}; %Verbindungen \begin{scope}[->] \foreach \p in {020,120,121} \draw[dashed](p011)--(p\p); \draw[dashed](p011)--node[sloped,above]{Text}(p221); \draw(p221)--node[sloped,above]{Text oben}node[sloped,below]{Text unten}(p141); \end{scope} \end{scope} \end{tikzpicture} \end{document} Wahnsinn, DANKE !!!!!!!!! Sogar mit Anleitung, ich arbeite das gerade durch und lerne extrem viel!!!! Genau das, was ich gesucht und gebraucht habe!!!!!
(03 Feb '15, 17:31)
roadrunner_ac
Hallo, ich habe mein Bild jetzt selber soweit bearbeiten können, wie ich das wollte. Bleibt noch eine Frage: Ich würde gerne die Beschriftung ein einem node verschieben, aber ich kenne nur Danke
(04 Feb '15, 20:27)
roadrunner_ac
|

Zur Info für Leser, die Frage wurde auch auf goLaTeX.de gestellt.